

INTRODUCTION
Understanding how flows actually execute in production has always required leaving Flow Builder, navigating to debug logs or analytics sections, and manually analyzing execution data. Admins and developers had to piece together information from multiple screens to understand: Which paths do users actually take? Are some elements bottlenecks? Is the flow performing efficiently?
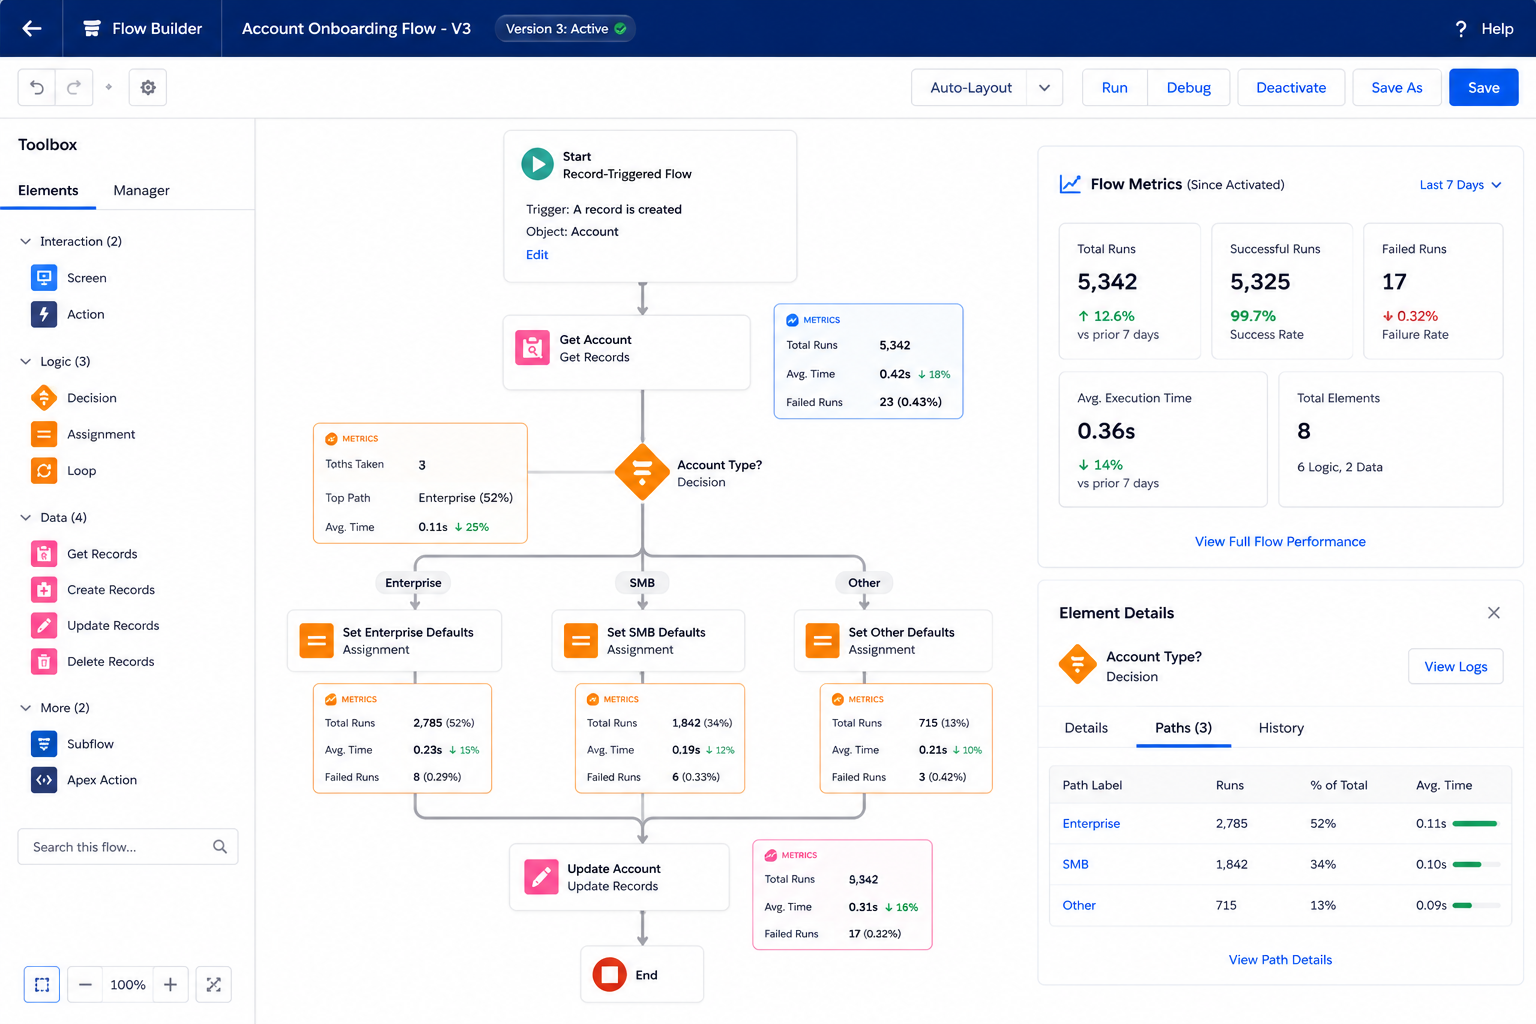
Spring ’26 introduces Flow Embedded Analytics—metrics displayed directly on flow elements as you design. Total runs, path execution, performance data all visible on the canvas. It transforms flow development from design-and-hope to design-informed-by-real-data.
This post explores what Flow Embedded Analytics shows, how to interpret the data, and how to use these insights to optimize flows.
THE FLOW VISIBILITY PROBLEM
Why Understanding Execution Matters
The Before Scenario: Manual Analytics
Situation:
Admin creates flow. Flow goes into production. Admin needs to understand how it’s performing.
Process (Before Spring ’26):
- Flow is active in production
- Admin wants to see execution data
- Admin leaves Flow Builder
- Navigates to Flow Executions or Debug Logs
- Searches for flow runs
- Reviews execution records
- Analyzes paths taken
- Identifies bottlenecks
- Returns to Flow Builder
- Makes optimization changes
- Repeats process
Problem:
- Manual, tedious process
- Data not visible while designing
- Easy to miss patterns
- Requires remembering details
- Context switching required
Real Scenarios Where This Mattered
Scenario 1: Decision Path Analysis
Admin creates approval flow with two paths:
– Auto-approve for small amounts
– Manual approval for large amounts
Question: Which path do users take most?
Before:
– Leave Flow Builder
– Review flow executions
– Count path invocations manually
– Back to Flow Builder
– Make changes
After:
– Open flow
– See metrics on decision element
– Immediately visible: 80% auto-approve, 20% manual
– Optimize accordingly
Scenario 2: Performance Bottleneck
Flow has multiple elements
Some elements slow, some fast
Question: Which element is bottleneck?
Before:
– Review debug logs
– Check execution time per element
– Manually analyze
– Return to builder
– Optimize
After:
– Open flow
– See execution metrics on canvas
– Identify slow element visually
– Fix immediately
Scenario 3: Unused Paths
Flow has optional logic paths
Question: Are they used?
Before:
– Manual analysis of executions
– Check if path ever taken
– Consider removing
– Manual verification
After:
– See metrics immediately
– Unused paths obvious (zero runs)
– Remove confidently
– Clean up code
WHAT FLOW EMBEDDED ANALYTICS SHOWS
Understanding the Metrics
Metrics Displayed on Canvas
Metric 1: Total Runs
What It Shows:
How many times this element has been executed.
Where It Appears:
On each element (Decision, Assignment, Action, etc.)
What It Means:
Element shows: Total Runs: 1,247
Interpretation:
– This element executed 1,247 times
– Flow ran and reached this element 1,247 times
– Previous elements ran 1,247 times minimum
– Following elements run 1,247 times maximum
Use Case:
- Identify heavily used elements
- Verify all elements are being executed
- Spot unused code paths
Metric 2: Path Execution
What It Shows:
Which decision paths are taken, how many times.
Where It Appears:
On Decision elements, showing branches
What It Means:
Decision element:
– True path: 800 executions
– False path: 447 executions
– Total: 1,247
Interpretation:
– Decision evaluated 1,247 times
– 64% of time: True path
– 36% of time: False path
– One path significantly more common
Use Case:
- Understand decision logic distribution
- Optimize for common path
- Verify both paths are used
- Identify imbalanced logic
Metric 3: Run Status
What It Shows:
Whether runs completed or failed.
Where It Appears:
On elements and overall flow
What It Means:
Element:
– Completed: 1,200
– Error: 47
Interpretation:
– 1,200 successful runs
– 47 errors occurred at this element
– 3.8% error rate
– Needs investigation
Use Case:
- Identify error-prone elements
- Track reliability
- Spot failure patterns
Metric 4: Average Duration
What It Shows:
Average time element takes to execute.
Where It Appears:
On elements
What It Means:
Element:
– Average Duration: 250ms
Interpretation:
– Takes 0.25 seconds average
– If many slow elements: overall flow slow
– Bottleneck identification
Use Case:
- Find slow elements
- Optimize performance
- Understand flow speed
Metric 5: Element Metrics Details
What It Shows:
Detailed breakdown by metric type
Where It Appears:
When clicking “Open Details”
What It Means:
Detailed view shows:
– Total runs: 1,247
– Completed: 1,200
– Errors: 47
– Average duration: 250ms
– Min duration: 50ms
– Max duration: 2,000ms
Use Case:
- Deep analysis
- Understand distribution
- Identify outliers
- Optimization data
USING ANALYTICS FOR FLOW OPTIMIZATION
Interpreting Data and Making Improvements
Use Case 1: Identifying Unused Paths
Scenario:
Flow has optional logic branch that might not be needed.
Analysis:
View flow canvas:
– Main path: Total Runs 1,000
– Optional branch: Total Runs 0
Interpretation:
– Optional branch never executes
– Code not needed
– Safe to remove
Action:
- Identify unused path (0 runs)
- Verify not needed
- Remove from flow
- Simplify design
- Reduce maintenance burden
Benefit:
Cleaner code. Easier maintenance. Removed dead code.
Use Case 2: Finding Bottlenecks
Scenario:
Flow seems slow. Need to identify slow element.
Analysis:
Element 1 (Get Records): Average Duration 150ms
Element 2 (Loop): Average Duration 50ms
Element 3 (Create Records): Average Duration 2,000ms ← Slow!
Element 4 (Send Email): Average Duration 100ms
Interpretation:
- Element 3 is bottleneck
- Takes 2 seconds average
- Other elements fast
- Element 3 needs optimization
Action:
- Focus on Element 3
- Optimize query or logic
- Consider batching
- Consider async processing
- Re-check metrics after change
Benefit:
Overall flow faster. Better user experience. Resource efficient.
Use Case 3: Validating Decision Logic
Scenario:
Decision logic should route 80% to one path, 20% to other.
Analysis:
Decision: “Amount > $10,000?”
– True (small amounts): 1,200 runs
– False (large amounts): 300 runs
Expected:
– 80% small (1,040 runs) – Reality: 80%
– 20% large (260 runs) – Reality: 20%
Actual distribution matches expectations!
Interpretation:
- Decision logic working correctly
- Distribution as expected
- No issues identified
Action:
- Validate decision is correct
- No changes needed
- Monitor for anomalies
Benefit:
Confidence in logic. Validation data. Proof of correct behavior.
Use Case 4: Error Analysis
Scenario:
Some flow runs fail.
Analysis:
Element: “Create Account”
– Total Runs: 1,000
– Completed: 950
– Errors: 50 (5% error rate)
Analysis:
– Most runs succeed
– Small percentage fail
– Needs investigation
– But not critical
Investigation:
- Check error logs
- Identify error pattern
- Likely cause: Validation failures
- Add error handling
- Re-test
Action:
- Add error handling
- Handle edge cases
- Improve flow robustness
- Monitor after fix
Benefit:
More reliable flow. Better error handling. Improved resilience.
Use Case 5: Performance Trending
Scenario:
Monitor flow performance over time.
Analysis:
Week 1: Average Duration 200ms
Week 2: Average Duration 250ms
Week 3: Average Duration 350ms ← Trending up
Week 4: Average Duration 450ms
Pattern: Consistent increase
Cause: More records being processed?
Investigation: Check data volume growth
Action:
- Identify performance degradation
- Understand root cause
- Optimize before it becomes critical
- Consider architectural change
- Implement fix
- Monitor metrics
Benefit:
Proactive performance management. Prevent outages. Maintain quality.
BEST PRACTICES FOR USING EMBEDDED ANALYTICS
Getting the Most Value from Flow Metrics
Best Practice 1: Regular Review
Pattern:
Weekly:
– Review production flows
– Check total runs
– Verify expected paths
– Note any anomalies
Monthly:
– Deeper analysis
– Performance trending
– Error rate review
– Optimization planning
Benefit:
Consistent monitoring. Early issue detection. Continuous improvement.
Best Practice 2: Baseline Metrics
Establish:
For each flow, document:
– Expected total runs per day/week
– Expected path distribution
– Acceptable error rate
– Target average duration
– Performance baseline
Use For:
- Anomaly detection
- Performance trending
- Validation of changes
- Optimization targets
Benefit:
Clear targets. Easy anomaly detection. Data-driven optimization.
Best Practice 3: Optimization Discipline
Process:
- Identify optimization opportunity
- Form hypothesis (why slow/unused)
- Implement fix
- Measure impact (before/after metrics)
- Document change and result
- Monitor for regression
Benefit:
Evidence-based optimization. Measurable improvements. Prevents regressions.
Best Practice 4: Share Insights
Communication:
Document metrics findings:
– Total runs per flow
– Popular vs unpopular paths
– Performance metrics
– Error rates
– Optimization impact
Share with:
– Team members
– Stakeholders
– Audit/compliance
– Future maintainers
Benefit:
Transparency. Knowledge sharing. Institutional memory.
Best Practice 5: Alert on Anomalies
Set Alerts For:
- Unexpected increase in total runs
- Error rate above threshold
- Average duration above baseline
- Path execution outside expected range
- Flow not running (unexpected zero runs)
Benefit:
Early warning of problems. Proactive response. Prevent issues.
INSIGHTS FROM ANALYTICS
What Different Metrics Tell You
High Total Runs
What It Means:
Flow is heavily used.
Implications:
- Critical to org operations
- Performance matters
- Reliability important
- Optimization valuable
- Needs monitoring
Actions:
- Optimize for performance
- Add error handling
- Monitor closely
- Plan for scalability
Imbalanced Path Distribution
What It Means:
One decision path used much more than other.
Could Mean:
- Logic is correct (some paths naturally more common)
- Logic is wrong (unexpected distribution)
- Data is skewed (more records of one type)
Actions:
- Verify is expected
- If unexpected, investigate
- Adjust logic if wrong
- Optimize for common path
High Error Rate
What It Means:
Element or flow failing frequently.
Implications:
- Data quality issues
- Logic errors
- Missing error handling
- Edge cases not handled
Actions:
- Investigate error cause
- Add error handling
- Handle edge cases
- Improve data validation
- Monitor after fix
Slow Average Duration
What It Means:
Element taking longer than expected.
Causes:
- Inefficient query
- Loops on large data
- External system latency
- Complex logic
Actions:
- Profile the element
- Identify bottleneck
- Optimize query or logic
- Consider async processing
- Measure improvement
Zero Runs
What It Means:
Element/path never executed.
Possibilities:
- Dead code
- Unreachable path
- Logic prevents execution
- Flow not being used
Actions:
- Verify intentional
- If unintentional, fix logic
- If dead code, remove
- Document if intentional
FINAL THOUGHTS
Flow Embedded Analytics transforms flow development from design-and-hope to design-informed-by-data. The metrics are simple—total runs, path distribution, performance data—but the insights are powerful.
For admins and developers, this feature enables:
- Confident optimization (based on real data)
- Early issue detection (before becoming problems)
- Better code quality (dead code removal, error handling)
- Performance management (proactive vs reactive)
- Informed decision-making (data not guesses)
The key is viewing it as continuous improvement, not one-time analysis. Monitor metrics regularly. Review flows monthly. Optimize based on data. The cumulative effect: flows that are faster, more reliable, and better maintained.
For organizations with large numbers of flows, this becomes essential infrastructure. Hundreds of flows in production. Which are critical? Which need optimization? Metrics make this clear.
Flow Embedded Analytics is another example of Salesforce making admin work easier and more data-driven. The feature is simple. The impact is substantial. When used well, it’s a game-changer for flow quality and performance.