

INTRODUCTION
Salesforce Dashboards have been powerful tools for visualization, but limited by what out-of-the-box widgets could do. Charts, tables, images, text—useful, but constrained. If you needed something custom, you were out of luck. You’d build it in a separate LWC-powered page and users had to navigate away from the dashboard.
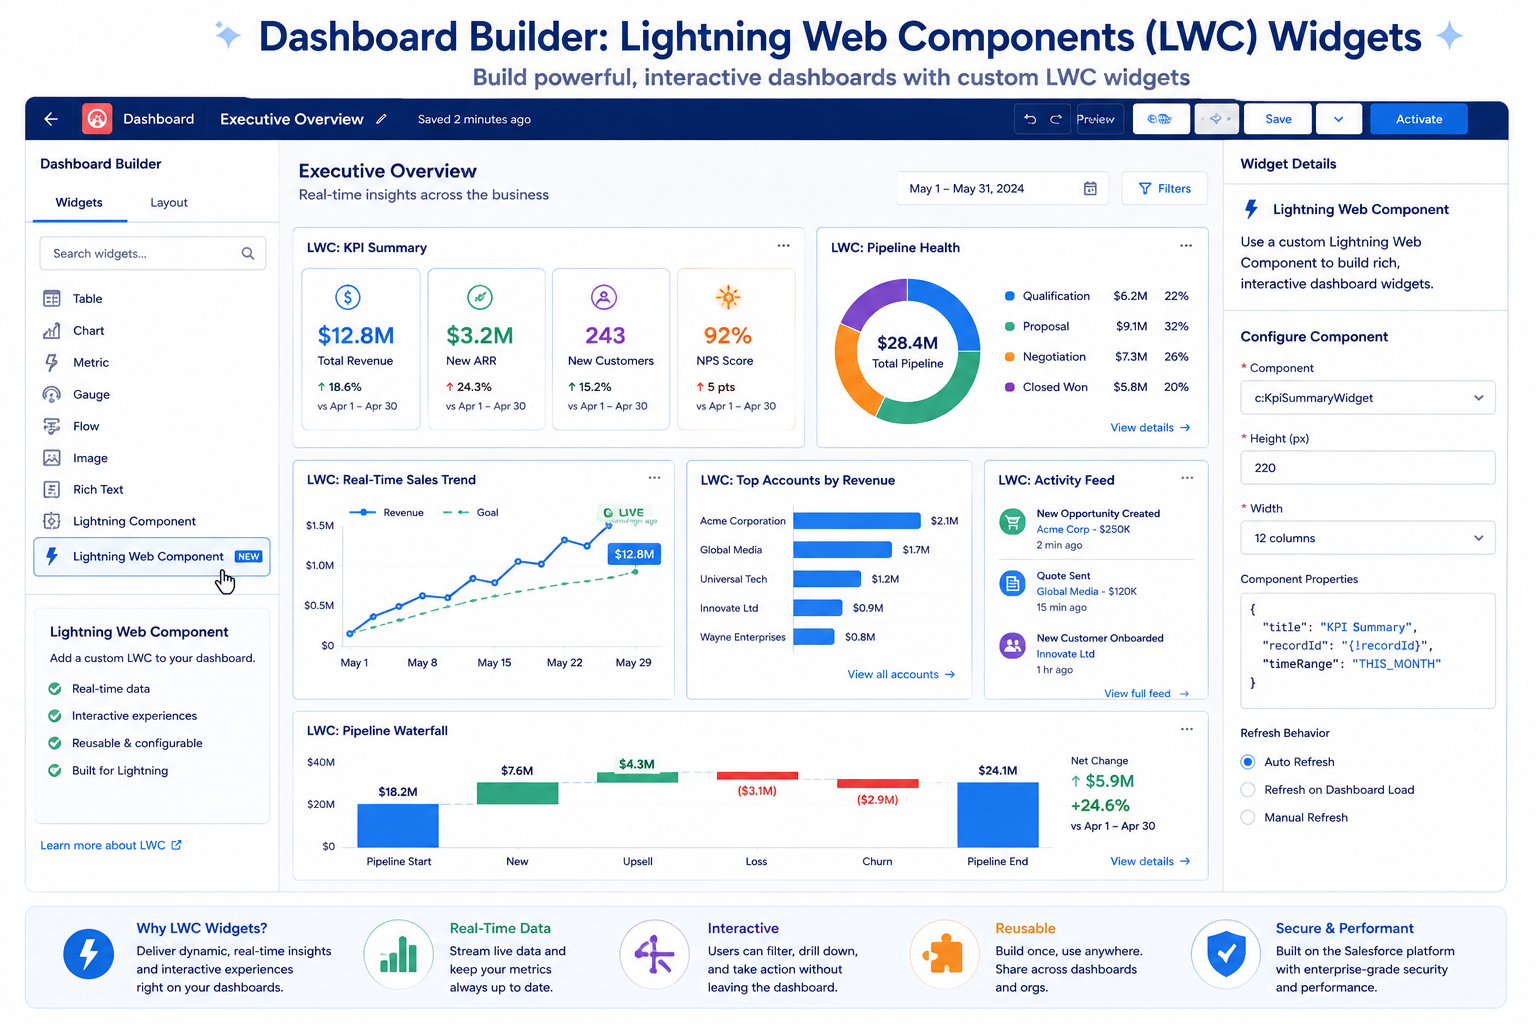
Summer ’26 changes this fundamentally: you can now embed custom Lightning Web Components directly on dashboards. Any LWC you build can become a dashboard widget. This transforms dashboards from static visualization tools into dynamic, interactive platforms.
This post explores what this capability enables, how to build dashboard-ready LWCs, and how it changes the relationship between developers and dashboard-building admins.
THE DASHBOARD LIMITATIONS PROBLEM
What Dashboards Could and Couldn’t Do
What Standard Dashboards Can Display
Widget Type 1: Chart Widgets
- Bar charts
- Pie charts
- Line charts
- Gauge charts
- All based on SOQL reports
Widget Type 2: Table Widgets
- Data displayed in table format
- Sortable columns
- Limited interactivity
Widget Type 3: Gauge Widgets
- Numerical indicators
- Progress visualization
- Simple metrics
Widget Type 4: Text and Images
- Static text
- Images for branding
- Labels and descriptions
Limitation Pattern:
All limited to standard, pre-built visualization types. No custom logic. No unique visualizations.
What Dashboards Couldn’t Do
Limitation 1: Custom Visualizations
- Want a heat map? Not available
- Want a network diagram? Not available
- Want a custom KPI card? Not available
- Stuck with standard charts
Limitation 2: Interactive Components
- Drill-down beyond standard capability
- Custom filtering logic
- Complex interactions
- Not possible in dashboard context
Limitation 3: Real-Time Updates
- Dashboard refreshes on schedule (15 min, 1 hour, etc.)
- Can’t subscribe to real-time data
- Pushing live updates to dashboard: impossible
- Users see stale data
Limitation 4: Custom Business Logic
- Calculations only via SOQL
- Can’t implement complex algorithms
- Can’t integrate multiple data sources in custom way
- Limited to report-based aggregations
Limitation 5: Custom Interactivity
- Click and drill-down limited
- Can’t create custom actions
- Can’t trigger flows from dashboard
- Can’t build custom workflows
The Workaround (Before Summer ’26)
Solution Pattern:
If you needed custom visualization, you’d build separate page:
Dashboard → Links to → Custom LWC Page
(standard widgets) (custom visualization)
User experience:
– View dashboard
– Click to see custom view
– Navigate away from dashboard
– View custom widget
– Navigate back to dashboard
Problems with Workaround:
- Breaks dashboard context
- Multiple pages to maintain
- Cognitive load on users
- Disjointed experience
WHAT LIGHTNING WEB COMPONENTS ON DASHBOARDS ENABLES
New Possibilities
Capability 1: Custom Visualizations
Examples:
- Heat maps (color-coded data grids)
- Network diagrams (relationship visualization)
- Sankey diagrams (flow visualization)
- Geographic maps (location-based data)
- Custom gauges (unique KPI displays)
- Timeline visualizations (temporal data)
Implementation:
Build LWC with custom visualization library:
LWC + D3.js = Heat map widget
LWC + Mapbox = Custom geographic widget
LWC + custom CSS = Unique KPI cards
Use Case Example:
Sales manager dashboard shows:
- Standard widgets (revenue, pipeline)
- Custom heat map widget (territory performance)
- All on one page, no navigation needed
Capability 2: Real-Time Data Updates
Before:
Dashboard refreshes every 15 minutes. Data 15 minutes old. Stale.
After:
LWC widget subscribes to Salesforce streaming events:
Dashboard LWC:
– Subscribes to Platform Events
– Receives real-time updates
– Updates UI immediately
– Users see live data
Use Case Example:
Support dashboard:
- Case queue shows real-time case counts
- Updates as cases created/closed
- No refresh needed
- Users see current state
Capability 3: Interactive Components
Examples:
- Click to drill-down to details
- Toggle between views
- Custom filtering logic
- Interactive selection
- Custom actions
Implementation:
LWC handles all interaction:
User clicks on data point
→ LWC handles click
→ LWC filters related data
→ LWC displays details
→ All within dashboard context
Use Case Example:
Revenue dashboard:
- Click on sales rep name
- Shows that rep’s opportunities
- Click on opportunity
- Shows opportunity details
- All without leaving dashboard
Capability 4: Multi-Source Data Integration
Before:
Dashboard widgets pull from Salesforce data only. Can’t integrate multiple sources.
After:
LWC widget can:
- Query Salesforce data via Apex
- Call external APIs
- Aggregate multiple sources
- Display consolidated view
Use Case Example:
Operations dashboard integrates:
- Salesforce customer data
- External inventory system (via API)
- External logistics system (via API)
- Displays consolidated view in single widget
Capability 5: Custom Business Logic
Before:
Dashboard limited to SOQL aggregation. Complex logic required separate system.
After:
LWC implements custom logic:
- Complex calculations
- Conditional logic
- Custom algorithms
- Business rule implementation
Use Case Example:
Sales forecast dashboard:
- Standard opportunity data
- Custom LWC widget runs forecast algorithm
- Displays predicted revenue
- All within dashboard
DASHBOARD DESIGN WITH LWC
Creating Effective Dashboards with Custom Widgets
Design Pattern 1: Hybrid Dashboards
Mix standard widgets with LWCs:
Dashboard Layout:
Row 1: Revenue Chart (standard) | Pipeline Chart (standard)
Row 2: Territory Heat Map (LWC) | Real-Time Calls (LWC)
Row 3: Forecast Model (LWC) | Notes (standard text)
Benefits:
- Leverage standard widgets for common use
- Custom LWCs for unique requirements
- Balance of simplicity and capability
Design Pattern 2: Custom Analysis Dashboard
All custom widgets for unique analysis:
Dashboard Layout:
Row 1: Network Diagram (LWC) | Timeline (LWC)
Row 2: Heatmap (LWC) | Sankey Flow (LWC)
Row 3: Custom Metrics (LWC) | Details (LWC)
Benefits:
- Unified custom experience
- Dedicated to specific analysis
- Complete control over design
Design Pattern 3: Interactive Drilldown
Widgets interact with each other:
Dashboard Layout:
Row 1: Account List (LWC – with click handler)
Row 2: Selected Account Details (LWC – responds to selection)
Row 3: Related Opportunities (LWC – filtered by selection)
Interaction:
– Click account in Row 1
– Rows 2 and 3 update based on selection
– All within dashboard
Benefits:
- Deep interactivity
- Exploration within dashboard
- No page navigation needed
Use Case Examples
Example 1: Sales Executive Dashboard
Widgets:
– Revenue Chart (standard)
– Pipeline Table (standard)
– Territory Performance Heat Map (LWC)
– Forecast Model (LWC)
– Real-Time Activity Feed (LWC)
Purpose: Comprehensive sales overview
Admin: Configures layout
Users: See everything needed to manage business
Example 2: Support Operations Dashboard
Widgets:
– Case Volume Trend (standard)
– Queue Status Table (standard)
– Real-Time Queue (LWC – live updates)
– Agent Performance Network (LWC)
– Sentiment Analysis (LWC)
Purpose: Operational visibility
Admin: Configures alert thresholds
Users: See real-time operations state
Example 3: Marketing Analysis Dashboard
Widgets:
– Campaign Performance (standard)
– Lead Conversion (standard)
– Customer Journey Map (LWC)
– Attribution Model (LWC)
– Engagement Heat Map (LWC)
Purpose: Deep marketing analysis
Admin: Configures time period filters
Users: Explore marketing effectiveness
ADMIN AND DEVELOPER COLLABORATION
How This Changes Workflows
New Collaboration Model
Before:
Admin: “We need custom visualization”
Developer: “Build separate LWC page”
Admin: “Add link to dashboard”
Users: “Click link, navigate away”
Result: Disjointed experience
After:
Admin: “We need custom visualization”
Developer: “Build LWC widget”
Admin: “Add widget to dashboard”
Users: “See custom widget on dashboard”
Result: Unified experience
Admin Benefits
Flexibility:
- Add custom widgets without page management
- Configure widget properties
- Add to multiple dashboards
- Customize appearance
User Experience:
- Everything on one dashboard
- No navigation needed
- Cleaner interface
- Faster access to information
Maintenance:
- Fewer custom pages to manage
- Centralized dashboard management
- Easier to update widgets
- One place for all data
Developer Benefits
Reusability:
- Build widget once
- Use on multiple dashboards
- Different configurations per dashboard
- No duplication
Focus:
- Build widget, not full page
- Dashboard handles layout
- Dashboard handles permissions
- Developer focuses on visualization
Testing:
- Test widget in isolation
- Dashboard integration automatic
- Easier testing
- Faster development cycle
CONSIDERATIONS AND LIMITATIONS
What to Know
Technical Considerations
Consideration 1: Performance
- Dashboard loads multiple widgets
- LWC performance impacts dashboard responsiveness
- Data fetching should be optimized
- Caching important
Consideration 2: Data Security
- LWC has access to user’s data
- Respects user’s permissions
- No elevation of privilege
- Ensure proper data access checks
Consideration 3: Responsive Design
- Dashboard uses 12-column grid
- LWC must adapt to different widths
- Testing at various sizes important
- Mobile dashboard support
Consideration 4: Refresh Cycles
- Dashboard refresh doesn’t automatically refresh LWC
- LWC can implement its own refresh
- Consider polling vs push updates
- Avoid excessive refreshes
Platform Limitations
Limitation 1: Managed Packages
- Managed package LWCs typically can’t be dashboard widgets
- Unlocked packages generally supported
- Check package documentation
Limitation 2: LWC Component Model
- Must be Lightning Web Component
- Aura components not supported
- Wire service supported
- Apex callouts supported
Limitation 3: Configuration Depth
- Simple property-based configuration
- Complex admin UIs not typical
- Keep configuration straightforward
FINAL THOUGHTS
Adding custom Lightning Web Components to dashboards is a significant capability expansion. It closes a gap that’s existed for years: the inability to customize dashboard visualizations and functionality.
More importantly, it changes the relationship between admins and developers. Admins can now request custom widgets and incorporate them directly into dashboards without workarounds or complex page navigation. Developers can build reusable components that admins configure and deploy.
The pattern mirrors what happened with Lightning Web Components on records and pages—initial introduction, then expanded to more contexts. Dashboards are the latest context where LWCs provide value.
For organizations with mature dashboard ecosystems, this opens possibilities for deeper analysis, better interactivity, and richer visualizations. Sales dashboards can show territory heat maps. Support dashboards can display real-time queues. Marketing dashboards can visualize customer journeys. All without leaving the dashboard.